
Speaker Identification (SID)
Phonexia Speaker Identification uses the power of voice biometry to recognize speakers by their voice… i.e. to decide whether the voice in two recordings belongs to the same person or two different people. Our goal as a regular participant of the NIST Speaker Recognition Evaluations (SRE) series is to contribute to the direction of research efforts and the calibration of technical capabilities of text-independent speaker recognition. The objective is to drive the technology forward and through the competing find the most promising algorithmic approaches for our future production-grade technology.
Basic use cases and application areas
The technology can be used for various speaker recognition tasks. One basic distinction is based on the kind of question we want to answer.
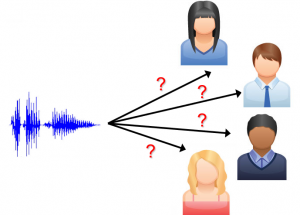
Speaker Identification is the case when we are asking “Whose voice is this?”, such as in fake emergency calls.
Usually this entails one-to-many (1:n) or many-to-many (n:n) comparisons.
Speaker Search is the case when we are asking “Where is this voice speaking?”, i.e. when looking for a speaker inside a large archive.
We have to do with Speaker Spotting when we are monitoring a large number of audio recordings or streams and we are looking for the occurrence of a specific speaker(s).
Speaker spotting can be deployed for the purpose of Fraud Alert.
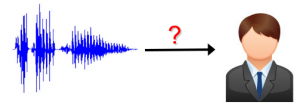
Speaker Verification is the case when we are asking “Is this Peter Smith’s voice?”, such as when a person calls the bank and says, “Hello, this is Peter Smith!”.
This approach of one-to-one (1:1) verification is also employed in Voice-As-a-Password systems, which can add further security to multi-factor authentication over the telephone.
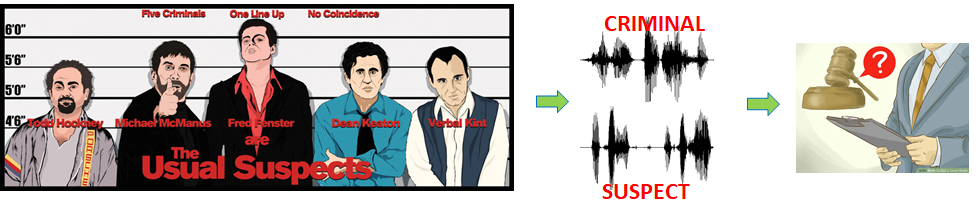
Large-scale automatic speaker identification is also successfully used by law enforcement agencies during investigation for the purposes of database searches and ranking of suspects. In later stages of a case, Forensic Voice Analysis uses smaller amounts of data and 1:1 comparisons to evaluate evidence and to establish probability of the identity of a speaker and use it in court.
How does it work?
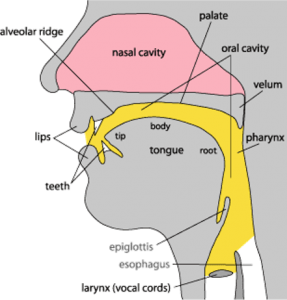
The technology is based on the fact that the speech organs and the speaking habits of every person are more or less unique. As a result, the characteristics (or features) of the speech signal captured in a recording are also more or less unique, thus the technology can be language-, accent-, text-, and channel-independent.
Automatic speaker recognition systems are based on the extraction of the unique features from voices and their comparison. The systems thus usually comprise two distinct steps: Voiceprint Extraction (Speaker enrollment) and Voiceprint comparison.
The processing speed depends on the technological model and can range from 5 to 50 times faster than real time on 1 server CPU core.
Voiceprint extraction is the most time-consuming part of the process. Voiceprint comparison, on the other hand, is extremely fast – a millions of voiceprint comparisons can be done in 1 second.
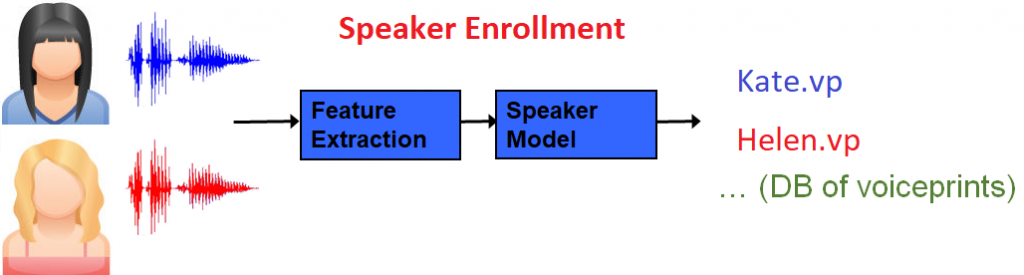
Voiceprint extraction (Speaker enrollment)
Speaker enrollment starts with the extraction of acoustic features from a recording of a known speaker. The process continues with the creation of a speaker model which is then transformed into a small but highly representative numerical representation called a voiceprint. During this process, the SID technology applies state-of-the-art channel compensation techniques. The voiceprint is a fixed-length matrix which captures the most unique characteristics of a speaker’s voice. It cannot be used to recreate the original audio file which is useful when the content has to stay anonymous.
The recommended minimum amount of net speech for enrollment is approx. 30 seconds (latest generation of Phonexia SID lowers this requirement to 20 seconds).
Voiceprints can then be stored in a database in the form of binary blobs, or in files (typically with .vp extension).
Here is an example of the voiceprint content in a human readable form:
Version:          40
Speech length:    18.799999 s
Content length:   1000 bytes
User data length: 0 bytes
Content data:
 5.573507 3.315646 3.519821 -2.426645 6.843580 -1.432263 -2.243011 -1.649323 2.136194 -2.494688 -3.733182 2.041409 -4.760473 -1.576752 -3.024205 -1.927082 1.253917 0.153468 -0.923258 -0.509448 -4.984461 3.218744 2.757949 4.167875 -0.711964 2.347041 -0.415159 2.617654 0.111331 -3.036171 -2.903871 1.983235 2.055066 0.163607 6.248895 0.285142 4.229355 -0.625493 2.049557 2.898942 -3.415202 0.687775 -3.963254 2.114511 0.344365 -0.063306 1.407159 0.611386 0.109995 -0.646962 -0.989935 0.813271 1.927760 3.202616 -1.728469 -1.209210 -2.685723 0.016170 0.200528 -0.651812 -1.290064 -1.001578 -1.406226 -0.305976 -5.248032 2.407877 -1.799586 1.338575 -2.197106 2.259264 -1.889788 -2.800648 1.290325 -0.120110 -2.157068 -1.849674 -0.231832 0.635230 -0.081109 -0.882723 -0.202572 1.059541 -0.110077 0.210153 -1.152915 1.393920 0.003471 0.708449 -0.201536 0.857028 -1.229550 2.583504 -0.342451 -1.118439 -0.415567 -1.564529 0.807927 -0.276171 -2.637402 -1.691306 -1.307633 2.275870 -0.847365 ...
Voiceprint comparison
Any voiceprint created from at least 10 seconds of speech – latest generation of Phonexia SID lowers this requirement to 7, or even 3 seconds for XL4 model – of an unknown speaker can then be compared with existing enrollment voiceprints and the system returns a score for each comparison. The score is produced by comparing two voiceprints using Probabilistic Linear Discriminant Analysis (PLDA).
Scoring and conversion to percentage
Score produced by comparing two voiceprints is an estimate of the probability (P), that we get the given evidence (the compared voiceprints) if the speakers in the two voiceprints are the same or if they are two different people. The ratio between these two probabilities is called the Likelihood Ratio (LR), which is often expressed in the form of a logarithm as Log Likelihood Ratio (LLR).
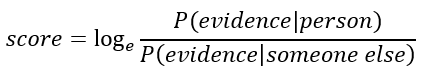
Transformation to confidence (or percentage) is usually done using a sigmoid function:
![]()
![]()
where:
shift shifts the score to be 0 at ideal decision point (default is 0)
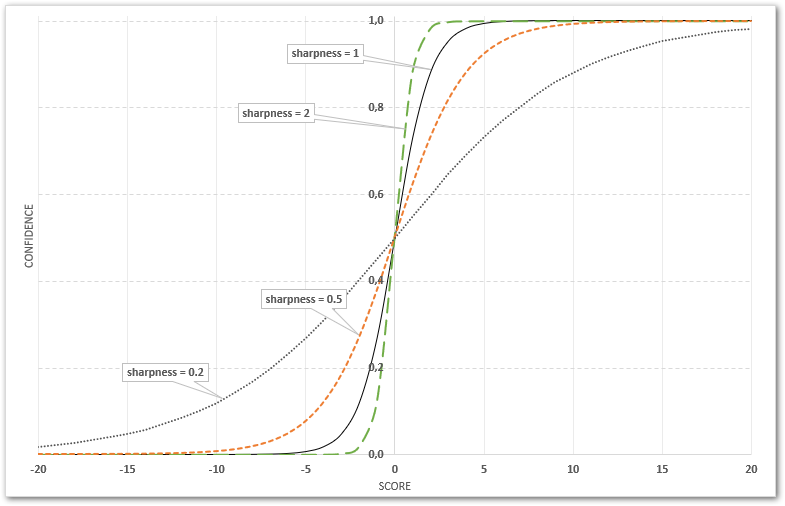
sharpness specifies how the dynamic range of score is used (default is 1)
The shift value can be obtained by performing a proper SID evaluation – see the chapter below for details.
The sharpness value can be chosen according to the desired steepness of the sigmoid function
- higher sharpness means more steep function – i.e. more sharp transition between lower and higher percentages, and only small differences in the low and high percentages
- lower sharpness means less steep function – i.e. the transition being more linear
Note:
It’s important to properly understand the correlation between score and confidence via the sigmoid function steepness, controlled by the sharpness value.
To get a better idea about the correlation, check this Microsoft Excel sheet demonstrating the sigmoid function: Score-to-Confidence.
SID evaluation
Before implementing Speaker Identification, it’s important to evaluate its accuracy using real data from the production environment. To evaluate the SID system, you’ll need enough of labeled data, i.e. recordings with speaker labels.
The principle of SID system evaluation is to compare (voiceprints of) all the individual recordings against each other and check the results of all the comparisons. Since it’s known which comparison is which – which compares the same speaker (called target trial) and which compares different speakers (called non-target trial) – it’s also known which comparison should give a high score and which should give a low score.
In the process of voiceprint comparison, two types of error can occur:
- False Rejection occurs when the system incorrectly rejects a target trial, i.e., the system says that the voices are different even though in fact they belong to the same person
- False Acceptance is when the system incorrectly accepts a non-target trial, i.e. the system says that the voices are the same, even though they belong to different persons.
One way to measure the performance of a speaker identification system is to calculate the trade-off between these two errors which can be shown in a Detection Error Tradeoff (DET) graph. By decreasing the threshold for acceptance we decrease the probability of a false rejection, but at the same time we increase the probability of a false acceptance.
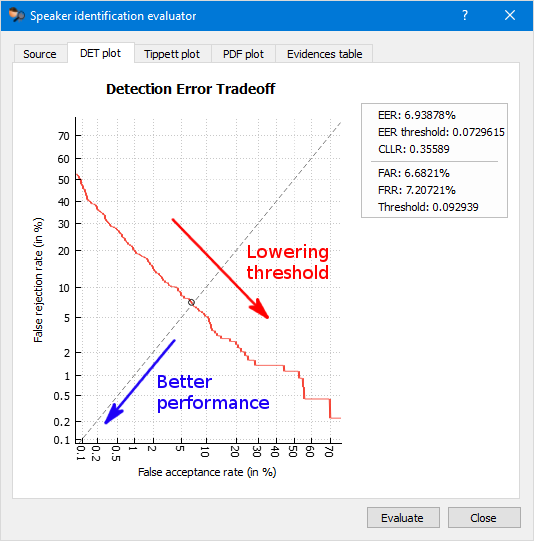
In an ideal system, we want both errors to be as small as possible. Better performance is indicated in a DET graph by the red line being closer to the origin (0 at both the x and y axes).
By properly setting the acceptance threshold the system can be adjusted for a particular use case.
For example, in the case of voice-as-a-password for the authentication of bank transfers when high security is desirable, the threshold should also be high.
For law enforcement agencies looking for any leads in a case, a higher false acceptance rate is an acceptable price to pay for not missing a bad guy’s call.
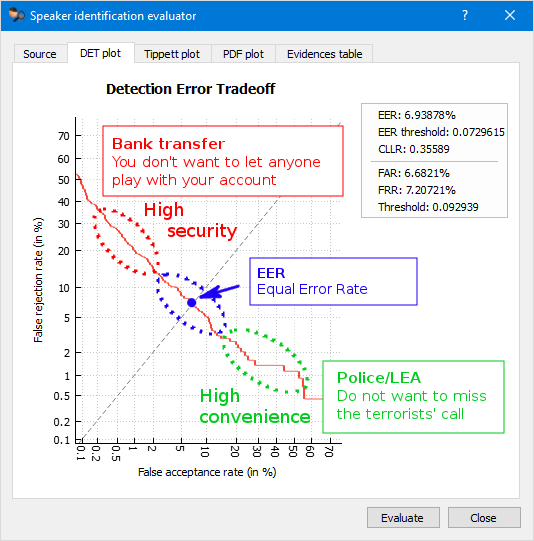
The operating point of the system when it makes the same number of false acceptances and false rejections is called Equal Error Rate (EER). It is a common measure of the system’s overall performance.
Phonexia Browser offers the Speaker ID Evaluation tool which can be used to perform such an evaluation.
The evaluation data set must fulfill these requirements:
- 50+ known speakers, 3–5 recordings per speaker (200+ recordings in total)
- 1+ minute of net speech in each recording
- only one speaker in each recording
- recordings as similar to the target use case as possible
- mono lin16 format, 8 kHz+ sample rate
This video shows how to perform SID system evaluation using Phonexia Browser:
SID calibration
The raw score must be calibrated to allow correct statistical interpretation. For example, in a well-calibrated system, the score of 1000 means that the user can be 1000 times more sure that the speaker in the questioned recording is suspected speaker rather than someone else. Technically, it also means, that 1 out of 1000 speakers was incorrectly detected in the development set. Another reason for calibration is for the score to be independent of the amount of evidence (amount of speech), channel, speech quality, etc. This step is very important for speaker spotting, or even in some forensic cases, so it is integrated in the SID technology and is performed in each voiceprint comparison.
In the 4th generation of Phonexia SID, we have introduced the possibility to easily enhance the results with Audio Source Profiles. The use of Audio Source Profiles enables the user to benefit from our traditional method of False Acceptance Rate calibration and adds the possibility to perform “Mean normalization” and “User calibration”. You can read more about the methods in a separate Speaker Identification: Results Enhancement post. Here is just a short overview of each method.
False Acceptance Rate (FAR) calibration – this calibration method adjusts the score threshold for detecting/rejecting speakers by removing the effect of speech length and audio quality. The system can be calibrated to a specific False Acceptance Rate (e.g., FAR=1%) for each reference voiceprint (speaker model). User FAR calibration is based on a set of recordings which should match the target use case as closely as possible (device, acoustic channel, distance from microphone, language, gender, etc.). Although the system is robust in such factors, this calibration will provide even better results and stronger evidence. However, the main purpose of FAR calibration is to ensure that the system produces only a specific amount of False Acceptances (see below) with the given data. To perform the FAR calibration, you’ll need a calibration set with at least 1000 recordings from unique speakers, which contain at least 60 seconds of net speech.
Mean normalization – compensates for the differences in channel, language etc. This method makes it possible to enhance the SID results. The normalization data set must contain at least 100 speakers.
User calibration – enables to change the “shift” and “scale” of the SID score, which is adapted with the following formula:
adjusted_score = scale × (original_score + shift)